Evaluation of financial asset profitability in the conditions of crisis phenomena
In global financial crises conditions, the issue of reducing the risk of financial assets that are already diversified becomes particularly relevant. One way to solve this problem may be to determine the feasibility of investing funds in a financial asset that is proposed to be added to the existing portfolio in order to obtain a guaranteed profit or preserve the capital level, taking into account the market risk that exists during the financial crisis.
The modern global financial market is a complex and dynamic system of supply and demand for financial capital, the stable functioning of which depends on the efficiency and structural changes of both national economies and the global economic system as a whole. The historical development of the global financial market has been influenced by such socio-economic phenomena as “global financial crises.” They have evolved together with the development of the world economy, integration processes, and globalization. Modern global financial crises affect financial markets, money circulation and credit, international finance, and manifest themselves through rapid growth of interest rates, debts, credit contraction, massive decline in the value of securities, massive losses in the derivatives market, and uncontrolled depreciation of national currencies [1].
In such conditions, the issue of reducing the risk of financial assets that are already diversified becomes particularly relevant. One way to solve this problem may be to determine the feasibility of investing funds in a financial asset that is proposed to be added to the existing portfolio in order to obtain a guaranteed profit or preserve the capital level, taking into account the market risk that exists during the financial crisis. Let’s solve the problem on the example of Apple Inc. using the asset pricing model (CAPM) [2]. To do this, it is necessary to evaluate the β coefficient according to the regression equation:
\[ r_i=α+β*r_m+ε \tag{1}\]
where \(r_i\) – the profitability of financial assets; \(r_m\) – the profitability of the market portfolio; \(α\) – the proportionality coefficient; \(β\) – the coefficient of changes in the profitability of financial assets depending on the changes in the financial market as a whole; \(ε\) – the model error.
Statistical data for calculations are compiled based on [3] and presented in Table 1.
| Date | S&P 500 | Apple Inc. Common Stock | S&P 500 – 1 | Apple Inc. Common Stock – 1 |
|---|---|---|---|---|
| 02.21.2023 | 4052,35 | 148,48 | ||
| 02.17.2023 | 4077,39 | 152,55 | -0,61% | -2,67% |
| 02.16.2023 | 4114,75 | 153,71 | -0,91% | -0,75% |
| 02.15.2023 | 4119,5 | 155,33 | -0,12% | -1,04% |
| 02.14.2023 | 4126,7 | 153,20 | -0,17% | 1,39% |
| 02.13.2023 | 4096,62 | 153,85 | 0,73% | -0,42% |
| 02.10.2023 | 4068,92 | 151,01 | 0,68% | 1,88% |
| 02.09.2023 | 4144,25 | 150,87 | -1,82% | 0,09% |
| 02.08.2023 | 4153,47 | 151,92 | -0,22% | -0,69% |
| 02.07.2023 | 4105,35 | 154,65 | 1,17% | -1,77% |
| 02.06.2023 | 4119,57 | 151,73 | -0,35% | 1,92% |
| 02.03.2023 | 4136,69 | 154,50 | -0,41% | -1,79% |
| 02.02.2023 | 4158,68 | 150,82 | -0,53% | 2,44% |
| 02.01.2023 | 4070,07 | 145,43 | 2,18% | 3,71% |
| 01.31.2023 | 4020,85 | 144,29 | 1,22% | 0,79% |
| 01.30.2023 | 4049,27 | 143,00 | -0,70% | 0,90% |
| 01.27.2023 | 4053,72 | 145,93 | -0,11% | -2,01% |
| 01.26.2023 | 4036,08 | 143,96 | 0,44% | 1,37% |
| 01.25.2023 | 3982,71 | 141,86 | 1,34% | 1,48% |
| 01.24.2023 | 4001,74 | 142,53 | -0,48% | -0,47% |
| 01.23.2023 | 3978,14 | 141,11 | 0,59% | 1,01% |
Based on the data in Table 1, model parameters were calculated using MS Excel tools. The β coefficient equals 0.68. Figure 1 shows the dynamics of changes in the profitability of financial assets of Apple Inc. depending on the change in the stock index (S&P 500-1) during the period of January-February 2023.
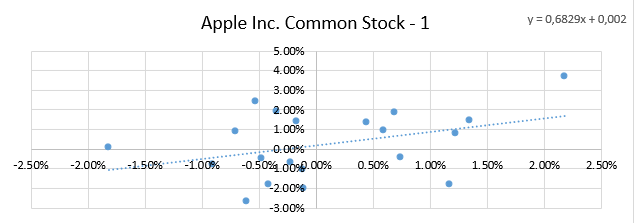
Since the β coefficient is less than zero, specifically 0.68, it is recommended to invest in Apple Inc. during the “fall” of the financial market during a crisis to preserve capital, taking into account the current market risk. This recommendation is based on the calculations of the model parameters using MS Excel, as shown in Table 1 and illustrated in Figure 1.
References
- Шабельник Т.В. Марена Т.В. Шабельник М.М. Моделювання виникнення світових фінансових криз у системі забезпечення фінансової безпеки країн. Бізнесінформ. 2020. - №3 – С.75-82.
- M. Tahir. An Investigation of Beta and Downside Beta Based CAPM-Case Study of Karachi Stock Exchange - American Journal of Scientific Research, 2005, Р. 118-135
- Yahoo Finance. URL: https://uk.finance.yahoo.com/quote/%5EGSPC?.tsrc=applewf&guccounter=1